The value of Business Intelligence (BI) on today’s market cannot be underestimated. The ability to convert a mess of data into structured and analysable information is extremely important to companies today. Presenting actionable information to help executives, managers and other corporate end users is crucial to help them make informed and educated business decisions. And that’s why custom dashboards play a key role in business applications.
But can I have a custom dashboard in an OutSystems Application?
Yes, you can. And we’ll tell you how we did it! ?
So, you’ve created your OutSystems application. The application is in production and there is a lot of data being generated and modified. Now… how can we make that data even more valuable?
To begin with, don’t use a cannon to kill a mosquito
Recently a client of ours asked if we could develop a dashboard with key indicators, according to user’s permissions and their personal preferences. We analysed all the options and came up with two answers: using a third-party BI Software or build the dashboard within the application.
#1 Using a third-party BI Software
There are multiple BI applications that can take all data and turn it into beautiful, usable reports. But this kind of software is so complex that, in this case, might be a disproportionate solution to our client’s needs. Additionally, those types of solutions would bring extra costs and extra work to integrate with our OutSystems data.
#2 Display indicators and charts within the OutSystems Application
The second option was to develop a mechanism to display indicators and charts within the OutSystems Application. This was the path we followed but wasn’t challenge free.
Although OutSystems provides tools to create dashboards, building the mechanism that allows to display customized dashboards according to the different user roles, requires some development.
Since our application had multiple user roles, with different business’ needs, the first instinct was to develop a dashboard page to each of them. But we needed to know all the user’s conditions prior to development, which we didn’t. In addition, as any growing business, these rules are constantly changing.
This status quo would make the list of requirements super extensive and complex, not to mention the maintenance overhead every time the business rules change.
Keep it simple, keep it user-friendly
As you can see, there were multiple unknown variables in this project. So, we decided to build a dynamic and customizable dashboard where users can select the charts or indicators they want to see, without any help from IT guys.
Okay. Now I’m sure you’re wondering how we did it. Let’s dive a little deeper.
This solution was developed in three stages:
- The first step was to developed the visual elements – charts and indicators;
- Then, since the user roles were previously defined in the application, it was only necessary to map the visual elements to the diverse roles;
- Finally, we created the mechanism behind the visual elements’ personalization, according with the user preference.
In practice, we developed a template (like the image bellow), with fixed spaces that can be filled with widgets. To maintain dashboard consistency, the template has dedicated spaces for certain visual elements. Smaller spaces1 could only be occupied with single indicators and bigger ones2 with charts of multiple types.

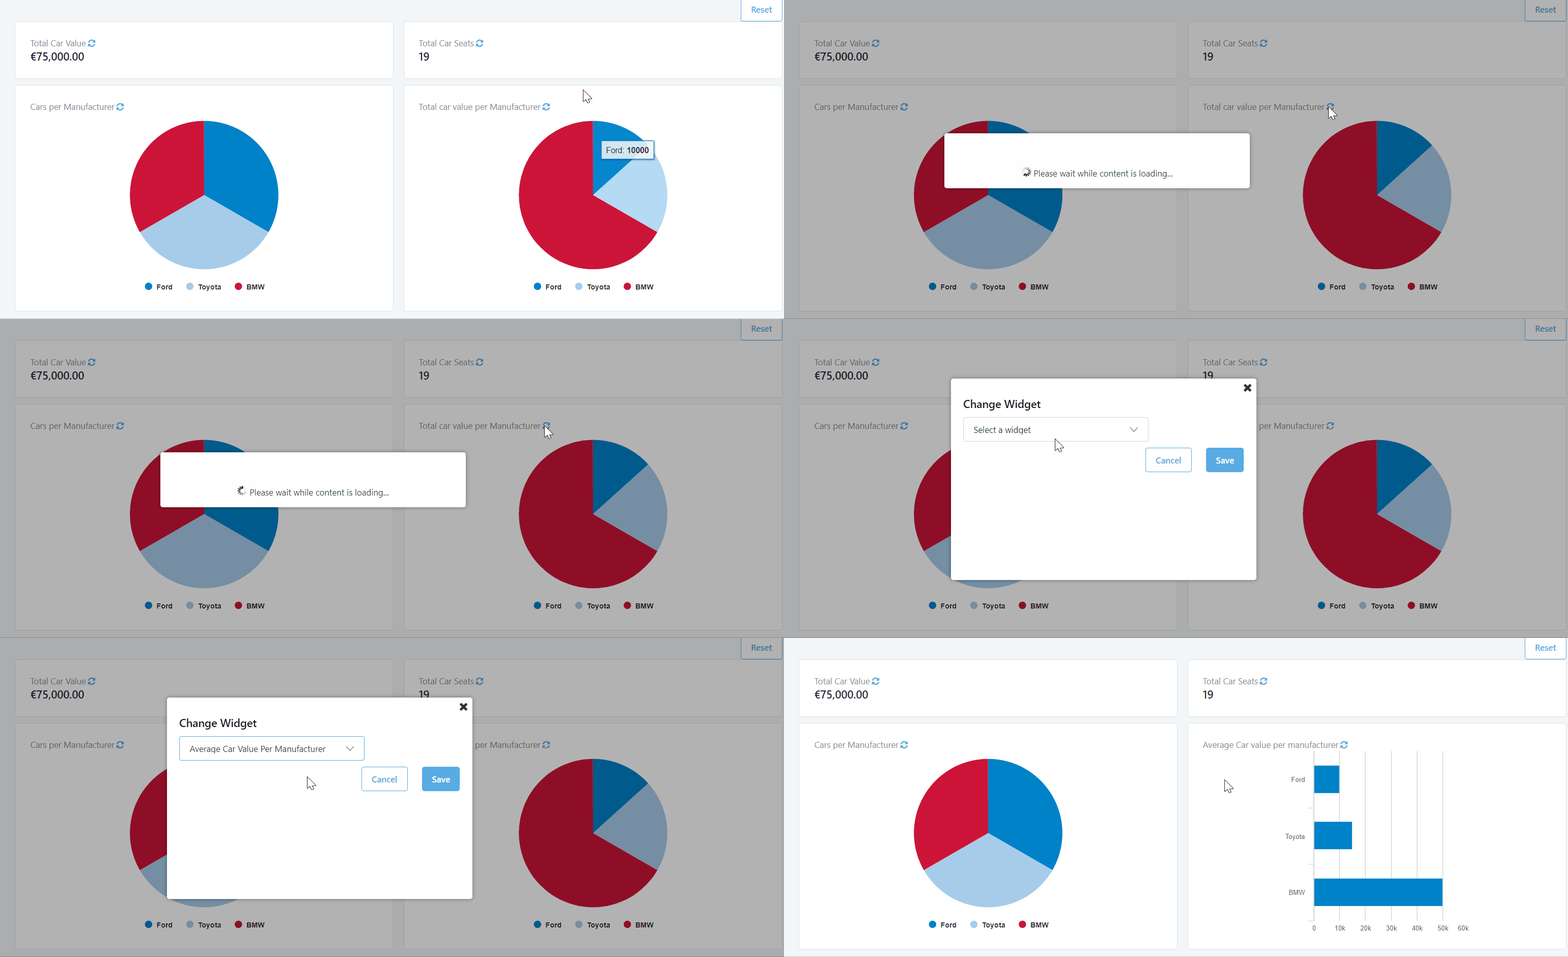
To change the indicators users must hit the update icon3. If they want to reset all data, they just need to click the reset button4 and the dashboard page will change to default widgets.
Let’s go through an example we’ve created to showcase this solution. As you can see, users can choose which data they want to see with just a few clicks!

Best value for money
This is how we managed to develop a customizable dashboard. In practice, we had to develop the widgets themselves and a mechanism to enable users to customize the dashboard as they wanted.
In no way, this can cover for a full-blown BI application, but it fulfilled our client’s needs and requirements. And this is a great solution for many cases out there. As I said before, there is no need to use a cannon to kill a mosquito. We wanted to keep it simple but efficient!
Yet, as problem-solvers, we developed a solution ready to grow and evolve. Features like letting the user change the layout template or drag and drop visual elements for easier and faster customization, can be easily added to this application.
At the end of the day, we are proud to have designed and built a solution that fulfilled not only all the requirements but offered an improved user experience, an overall reduced future maintenance and room for improvement. And that is what excited us the most!
What about you? Are you having problems building dashboards in OutSystems? Can we help you with something? Share your needs with us.
|


